|
|
| Line 47: |
Line 47: |
| | *The silicone filling the ping-pong balls that housed the sensors in Phase One never cured. For Phase Two, we made a casting of a ping-pong ball (which is the same size and shape as a turtle egg), and used it to cast solid polyurethane "eggs" around the sensor circuit boards. The polyurethane is fully set in less than a day, does not out-gas, and is very hard and durable. | | *The silicone filling the ping-pong balls that housed the sensors in Phase One never cured. For Phase Two, we made a casting of a ping-pong ball (which is the same size and shape as a turtle egg), and used it to cast solid polyurethane "eggs" around the sensor circuit boards. The polyurethane is fully set in less than a day, does not out-gas, and is very hard and durable. |
| | | | |
| − | ==Phase Two Implementation (2014 Sea Turtle Season)== | + | == Phase Two results== |
| − | Test units started being installed in sea turtle nests in June of 2014. The plan is to monitor about 20 nests at the Cape Hatteras National Seashore and a few more at the Bald Head Island Conservancy, both in North Carolina.
| + | :''For more detail, see [[Turtle Sense / Project logs]] |
| − | | |
| − | The units constantly monitor and analyze motion to create a profile of its magnitude over time. The motion detector measures the change in acceleration (or "jolt") multiple times per second. The magnitude of the jolt is placed on a logarithmic scale divided into 25 different ranges. The ratio between the lower and higher limit of each range is the square root of 2. A counter for each of the different ranges is incremented whenever a jolt reading is in that range. You can think of each counter as a bin. If a magnitude is in range, it is thrown into the bin for that range. After 6 minutes the results are stored in a record along with a temperature and orientation reading, and a new set of bin counters is started. By looking at how many readings were in each bin, we can get an idea of what jolts occurred while the bins for that record were being filled. This allows us to compress several thousand readings into approximately 32 bytes of information. We lose precision (including the exact sequence) with all the readings, but we suspect that those details are not important. The 240 records created each day give us a very good idea of what is happening in the nest.
| |
| − | Research indicates that before emerging from the nest in a "boil," turtle hatchlings congregate underground near the top of the nest. It is thought that this motion stimulates the hatching of the turtles that haven't yet emerged. Our sensors, situated at the top of the nest, should record some large disturbances when the first turtles emerge. It is our hope that our readings will indicate these early hatchings so that we can predict that a boil is imminent.
| |
| − | | |
| − | The nests with first units installed should be hatching around mid-to-late August. We will be generating algorithms to predict hatching from our data, and we plan to refine those algorithms so that we can come up with a reliable process for predicting hatching a few days in advance.
| |
| − | | |
| − | ==Summer 2014 Field Notes Entry #1: First Tests==
| |
| − | We currently have about a dozen sensors installed in nests, but only three of them are connected to communications devices. For the first month after a clutch of eggs is laid, there is little or no activity in the nest. Since this is the first testing of our devices in the field, we want to fix any bugs in the first devices before sending out lots more.
| |
| − | | |
| − | The first communicators were installed around the end of June, just in time to be tested by some very extreme conditions during Hurricane Arthur. We didn't know what to expect. Would the cement anchors on the PVC pipes that house the communicators be secure enough? Would water find a way into our hermetically sealed enclosures? Would the nests get washed away? We changed the parameters on the units so that they phoned in every two hours instead of once a day. We figured if the units failed, we'd get information right up until two hours before they failed. As we watched the hurricane forecasts, the storm track was pointing directly to where our first devices were installed.
| |
| − | | |
| − | The units made it through the Category 2 hurricane without any problems. So, now we know that they can handle severe weather. We also learned something very important from the storm. We had been worrying that environmental noises and disturbances might make it hard to tell the difference between those disturbances and hatching eggs. What we found from the data during the hurricane is that it is very quiet two feet below the beach. The noise level from crashing waves, blowing sand, and torrential rain was barely noticeable in our data. On our logarithmic scale, that means that the noise level during the storm is no more than about 40 percent above normal. Since our scale has about a 1:1,000,000 range, 40 percent is not significant. The noise level we are encountering in the nests is comparable to the noise level on the table in my empty kitchen when I was testing the sensors overnight.
| |
| − | | |
| − | So what does this mean about the motion we will record as the embryos start moving and later when the eggs start hatching? This is the big unknown. We'll find out soon.
| |
| − | | |
| − | ==Summer 2014 Field Notes Entry #2: Hurricane? Yes. Postal Service? No.==
| |
| − | So, we got through Hurricane Arthur without a problem, and we decided to send some more Communications Units into the field. We sent them out via the USPS Priority Mail. The units are housed in schedule 40 PVC pipe, which is really, really strong, so we thought that there wouldn't be a problem in the mail. We were wrong. It turns out that we planned for everything except for the abuse that the units would receive in transit.
| |
| − | | |
| − | Most everything in the device is soldered together, but there are a few connections that are not. The cell phone board is plugged into headers. There are several boards available from the manufacturer that work with different telecoms. The boards could be soldered in, but we wanted to be able to swap in a different board for different carriers if need be. With 49 pins holding it in, it takes quite a bit of effort and wiggling to get it out and seemed very, very secure. But not secure enough for the USPS! Similarly, the eight AA batteries are secured in a battery pack, and the pack can be unplugged with a standard 9 volt battery clip. These take quite a bit of force to put on and take off, but the trip cross country in the mail was enough to shake it loose. None of the units in our last shipment was working by the time they made it from California to North Carolina.
| |
| − | | |
| − | The repair for these problems is very simple, and in retrospect we might have anticipated this issue. To secure the board and the battery clip, we tightened cable ties around them. There is no way to get them loose without cutting the ties off.
| |
| − | | |
| − | So the moral of the story is, when you are designing a product, don't worry about making it hurricane proof. Make sure it can make it through the post office.
| |
| − | | |
| − | ==Summer 2014 Field Notes Entry #3: Results from the First Nest==
| |
| − | We had our first boil yesterday, August 10th, and I'm happy to report that the day before the boil, I sent an e-mail to the National Park Service saying that I thought something might be happening in the nest. Given this, it might actually be possible to predict when a nest will hatch!
| |
| − | After the boil, I spent a few hours looking at all the data to see what I could find, and the results were not quite what I had expected. In fact, I have a new hypothesis about how to predict when a boil is about to occur.
| |
| − | | |
| − | Previously, I had heard that the activity from the turtles moving around in their eggs and then from hatching stimulated the other turtles to hatch, and that somehow they coordinated the boil from all this motion. From looking at the data, I think what might be happening is that the motion ramps up gradually until they start hatching. Then, as they hatch, the motion becomes erratic. Finally, after they all have hatched and are waiting for the boil, everything quiets down. It is this quieting down that might be the clue to the turtles that all their siblings have hatched and it is time for a boil. It makes sense, since as each turtle hatches, there is no need for it to move any more. All it needs to do is wait for everyone else to finish their wiggling. If there is no wiggling, all the eggs have hatched, and it is time to go.
| |
| − | | |
| − | From looking at the orientation of the sensor, it appears to have rotated a little between 2 PM and 7 PM on August 7th, which appears to be the period when there were the largest jolts. This makes sense if this movement was from the collapse of the nest as the turtles hatched. The sensor would get lower, and its orientation would rotate about as much as can be seen in the data.
| |
| − | | |
| − | It will be interesting to see what the data looks like from some more hatching nests and whether they all look similar. Who knows? Another nest might be boiling as I write this.
| |
| − | | |
| − | The data was also quite surprising in another respect. The boil itself is hardly noticeable. In fact, I'm not exactly sure what time it occurred from looking at the data. There were no dramatically large motions. I thought for sure that we would get very high readings when the baby turtles moved past the sensor egg. It looks like the sand might have absorbed much of the energy. It might also be that when the nest collapsed, the sensor did not sink with it as much, and very few of the turtles had any contact with the sensor. It will be useful to know the orientation of the sensor relative to the egg shells when nests are excavated.
| |
| − | | |
| − | ==Summer 2014 Field Notes Entry #4: Real World Problems==
| |
| − | We now have about two dozen sensors in the field and about a dozen communicators. Early on, we made a test unit. That unit has been operating for weeks sitting on a counter here in San Francisco, and it has never skipped a beat, missed a report, or had a problem of any kind since we got everything working. The units in the field have not all been so reliable. Some of them have worked flawlessly for months, and some of them never powered up. Over all, they are working about 90 percent of the time. Testing electronics in the wet, salty sea environment tests your design in extreme ways.
| |
| − | | |
| − | We are building and programming more than 2500 miles from where the units are being deployed. We need them to run, unattended, for more than two months, enduring moisture, salt, wind, blowing sand, and who knows what else. When they stop working, we can't easily determine what went wrong, and that is a challenge. With two custom devices interconnected and running a third device talking to a server, there are lots of places where things can go wrong. This is where "hacking" turns into full-scale engineering.
| |
| − | | |
| − | It is one thing to get the basic functions of a device up and running. That part is fun--it requires innovation and creative design. But getting everything to work flawlessly in the field requires diligence, attention to detail, and lots of trouble shooting. That is much less sexy. For this project to be successful, we have to make units that are totally reliable. Ninety percent is not sufficient.
| |
| − | | |
| − | We've learned quite a bit about the ways things can go wrong. Boards can come loose, connections can break, moisture and salt can get into places they are not supposed to get into. Cell phone reception can be interrupted by lightning, and that can cause embedded code to hang.
| |
| − | We anticipated several processes that could fail and programmed the code to handle the problems as they happened. For everything else, there is a watchdog timer that resets the device. But it is difficult to test how things will behave when they fail, if you can't observe them failing. We don't get thunderstorms in San Francisco, and being in the middle of the city, the cell phone reception is excellent. This summer is teaching us about all the problems we will need to deal with.
| |
| − | | |
| − | There are two main things we have learned thus far. First, the watchdog timer works for most unanticipated problems, and the system recovers most of the time. But we need to handle recovering from resets better. Sometimes the system recovers and no data is lost, but sometimes we lose a few hours’ or a day’s worth of data. We knew this might happen, and we knew how to fix it, but unfortunately, we ran out of code space in the 16K devices we are using (TI's MSP430s) to implement the fixes. Just at the point when we ran out of code space, TI introduced new versions with up to 128K of memory. These new processors should be more than adequate for what we need. But making these fixes is out of the question for this year. The devices are in the field, and the turtle season is half over. So for now, we are accumulating more knowledge about the ways our devices can fail. We will incorporate recovering from those failures into the next version of the software.
| |
| − | | |
| − | Second, the connection between the Smart Sensor and the Communications Unit is the weak link in our design. We consulted with a few engineers about what connector to use, and we ended up choosing a 9 pin Molex connector with gold contacts. The first thing we discovered was that the cable connection to the connector was prone to failure because the outer cover of the cable was removed near the connectors. In the field, the cable bent easily during connecting and disconnecting. The thin wires in the Cat5e cable could easily break after a few uses. So we cast the ends of the connectors and the cables in quick-setting polyurethane to make it strong. It did make it strong, but the polyurethane wicked its way up into the connector and made some of the crimp connections unreliable. So, we started soldering the crimp connections after they were crimped. This seems to work much better. But the solution became very labor intensive to make and difficult to repair. Ultimately, we need a better, simpler, and cheaper way to connect these units. We are considering using a single coax cable for the next version. We would send RF signals in both directions over the coax line, and we could also use the coax line to send power to the sensor. Coax has a long history of being used outdoors, and there are a selection of waterproof connectors and tools to do quick repairs. We are also considering ways to make a wireless connection between the devices, but that might create more problems than it solves. The "power over coax" solution could be engineered so that device can easily be adapted for wireless use as well. This would be very good for applications that do not involve underground nests.
| |
| − | | |
| − | ==Summer 2014 Field Notes Entry #5: Hatching or Ghost Crabs?==
| |
| − | We've completed the monitoring of five nests so far. One sensor failed in a nest (due to a bad connection). Eight nests are being monitored currently, and another four are awaiting a spare Communications Unit to become available. So, we should have data from about 17 nests to evaluate. Using our theory about hatching, which we are now calling the "popcorn" theory, we were able to predict several boils. The popcorn theory is that the turtle eggs are like popping corn in boiling oil. When the kernels heat up, they start to jiggle a little, and then they all start to pop at once. When you hear the popping quiet down, you know it is time to pour everything out of the pot. So, we theorize that the turtles are all programmed to listen for things to quiet down after hatching, and that way they know that it is time to leave the nest.
| |
| − | | |
| − | Popping (hatching) shows up in our data a few days (3-5) before the turtles pour (boil) out of the nest. The sensors are sending 240 records in each report, and each report is phoned in every 4 hours. So each record is a profile of what happened each minute of the day. We can see how many readings there were in about 25 ranges of acceleration from .001 G to about 4 G. We've arranged these ranges logarithmically because we did not know what values we'd be getting. We thought there would be a huge dynamic range between background noise and the motion of hatching turtles hitting the sensors. It turns out the dynamic range is not that large--about 4:1. In future versions, we can design our data collection to get more resolution in the ranges that we are recording.
| |
| − | | |
| − | To graph the data, we integrate all the readings during each minute's report to get a single numerical value. This value corresponds roughly to the energy from the motions recorded. We can graph the data versus time to see what is happening.
| |
| − | | |
| − | ==Fall 2014 Update #1: A Visit to Our Sites==
| |
| − | I just returned from nine days visiting our two test sites in North Carolina. While there, I got a chance to see baby sea turtles making their way to the ocean and to talk with wildlife managers and biologists. I learned quite a bit from the trip. We went out for several nights to visit a nest where I had predicted a boil using the data from our sensor. The turtles emerged two days later than expected, but that was not surprising considering that the temperature had been cooling down in the prior two weeks, and the previous nests had hatched during warmer periods. The boils often occur between sundown and about 10:00 PM, which is when we usually gave up and went home. This nest ended up boiling a little after midnight.
| |
| − | Nest sitters must wait for the boil in total darkness because lights can confuse any baby turtles that emerge. So there's nothing much to do except talk and enjoy watching and listening to the phosphorescent waves. This gave all of us many hours to talk about our progress so far and to discuss how the data correlates to what is happening underground. I spent much of the time talking with Britta Muiznieks, National Park Service (NPS) biologist and liaison with our project who was our host at the nest site.
| |
| − | | |
| − | The week before, I got a chance to meet staff from the Bald Head Island Conservancy at the southeast tip of North Carolina. While travelling from Bald Head Island to Cape Hatteras, we stopped to meet with Matthew Godfrey, who is the Sea Turtle Program Coordinator at the North Carolina Wildlife Resources Commission. I was very surprised to learn that there was little data about the timing of events in sea turtle nests before a boil. Part of the reason for this is that it is so difficult to study what is happening. Studying sea turtle nests risks invoking the Heisenberg Uncertainty Principle. If you look in the nest to observe what is going on, you might be having a major effect on what happens. So our apparatus is a welcome addition to tools that biologists can use to understand what is happening inside the nests.
| |
| − | | |
| − | All these biologists are also responsible for managing wildlife, and it was here that our discussions led to several ideas about how we can use our technology for the benefit of Sea Turtles.
| |
| − | | |
| − | At the Cape Hatteras National Seashore, the issue has been off-road vehicle management, but at Bald Head Island, like at many other beaches, there are no off-road vehicles on the beach. There the issues are twofold: monitoring the nests for events that could harm the turtles and managing volunteers. Predators often attack the nests, and high tides and storms can cause over-washes that suffocate the nest. These harmful events are often discovered too long after the fact for wildlife managers to be able to intervene in any effective way. Fortunately, we are able to see these events in our data. Predation appears as a very sharp and intense spike of activity. Over-washes look like a sudden attenuation of the energy readings we get. It is likely that we can create an automated system to recognize these changes in the data and send out e-mail or text alerts to wildlife managers so that immediate action can be taken. For example, one of our nests was washed away by high tides a day or two before a boil was expected. We knew that the eggs had hatched from the activity we saw. What I learned was that turtles still have their yolk sacks attached after they hatch, and it takes a few days for them to fully absorb the remaining nutrients so they have enough energy to make the journey to the ocean and find their first meal. Wildlife managers, knowing that threatening high surf could drown the hatchlings, could have rescued them beforehand and released them later when they were ready. Similar intervention is possible if there is major predation. Because boil times have been so difficult to predict, volunteer nest sitters could spend two weeks or more monitoring a nest waiting for it to boil. With our technology, we can probably reduce that time to one-to-three days. This means that a single volunteer would be able to monitor several nests during the same time they currently spend monitoring just one nest. So our technology is not only able to help biologists understand what is going on, but it also gives wildlife managers a tool that they can use to help increase the success rate of the nests.
| |
| − | | |
| − | The initial inspiration for our project came from a desire to create a win-win solution to the conflict between those who are responsible for managing wild life and those who want to maintain access to the beaches. We have made significant progress in creating a win-win solution to this problem by successfully predicting boils at almost all of the nests we have looked at, even without knowing exactly what the data means and with little or no previous data to back up our predictions. The chances of this being implemented on a large scale are looking very positive. But the most gratifying part of our journey was discovering so many ways that we might also be improving the survival rate of the baby sea turtles. Win-win-win.
| |
| − | | |
| − | ==Fall 2014 Update #2: New Volunteers==
| |
| − | Welcome to a few new people on the team:
| |
| − | *Harriet Durling Kaplan (Eric's wife) has volunteered to be our "editor in chief." She's been going through the wiki postings and the Hackaday entry, fixing my misplaced commas and untangling my awkward sentences. We should all have her look over any written materials we post on-line or send to the media. As Harriet gets more comfortable editing the wiki, she will be able to work on keeping it up to date.
| |
| − | *Lou Browning has been involved in this project since early on, but I forgot to add him to the list of people receiving these updates, and I sincerely apologize for the oversight. Lou has been recording the sounds in sea turtle nests for years and helped Tom Zimmerman install and maintain turtle sense units during Phase One. His expertise will be much appreciated as we try and understand what our data means.
| |
| − | *Richard Green is a friend of Tom Zimmerman. They worked at the San Francisco Exploratorium together. Richard is volunteering to do some analysis on our data and has some interesting theories about how it correlates with the tides and lunar cycles.
| |
| − | | |
| − | ==Fall 2014 Update #3: Hackaday Prize==
| |
| − | Our submission to the Hackaday Prize didn't make the cut. We are not one of the five finalists. It was a mad dash to the finish line to get everything submitted in time for the semifinal round. If you haven't seen it yet, check out the video we made for the semi-final round. A big thanks to everyone who helped with our entry, especially Thomas Briley for his work on the video, including a wonderful new logo for NerdsWithoutBorders. Losing is bittersweet. I'm glad we did the work necessary to enter, as it was a great impetus to get everything organized and documented, but it is too bad we won't get the prize money, which would have helped us take the project international. However, in the long term, I don't think money is going to be an issue that slows us down much, if at all. I'm relieved it is over. Now we can focus our energy on Phase Three. We did win a $1,000 "grab-bag" of electronic goodies, which hopefully will be something we can actually use. If not, I'll be looking for a non-profit to donate them to.
| |
| − | | |
| − | ==Fall 2014 Update #4: On the East Coast==
| |
| − | Dave and I have been on the East Coast for the last four weeks. We had a great time visiting Cape Hatteras and Bald Head Island. It was a pleasure meeting the people we have been working with for the past year. Dave Schneider, the reporter from NPR's "Here & Now" was there with us for three days. We were hoping we could all witness a boil together, but the nest we were monitoring was uncooperative and did not boil until the night after he left (two days behind schedule). Dave, Britta, Eric and I went back to the nest that night, but the turtles waited until just after midnight for the boil, and we had left shortly after 10 PM. Schneider's piece on NPR is finished and should be broadcast in the near future.
| |
| − | | |
| − | We met with Nicki Dardinger and Suzanne Dorsey at the Bald Head Island Conservancy. It was great to hear their ideas about how they might use Turtle Sense to help monitor nests. There are no motorized vehicles allowed on the beaches on Bald Head Island, so their concerns are a bit different than those on Cape Hatteras. We realized that there could be some significant benefits from being able to predict hatching and to be made aware of disturbances to the nests caused by predators or surf over-wash. When we create the next version of hardware and software, along with our planned alert system in the website, we should include the ability to send out instant alerts if there is any disturbance at a nest. Timely alerts could lead to actions that might help save otherwise doomed baby turtles. Another advantage unrelated to vehicles is the ability to multiply the effectiveness of nest sitters. Currently, some nest sitters will spend up to two weeks waiting for a boil. With an effective predictor of boils, we might be able to multiply the number of nests that each volunteer can monitor by a factor of five or more.
| |
| − | | |
| − | On the way from Bald Head Island to Cape Hatteras, we stopped in Moorhead City to meet Matthew Godfrey, a sea turtle biologist with the N.C. Wildlife Resources Commission. We spent more than two hours with him, showing him the technology and data we have accumulated. He was very enthusiastic about our project, which is very good, because his help will be very important to getting our technology accepted for wide-scale adoption.
| |
| − | | |
| − | Nests continue to hatch and boil at Cape Hatteras. For the most part, we have been able to predict almost all of the boils in advance. One boil was obscured by very frequent predation by ghost crabs. We missed predicting that one, but a more thorough analysis of the data from that nest might point to a way that could have predicted it. There was also a recent nest that started hatching not very long after we started monitoring it, and we missed predicting the hatching until about the same time that the nest boiled. This nest was the first that was up in the dunes, and we may need more data and a different approach before we can make predictions about nests like this.
| |
| − | | |
| − | ==Fall 2014 Update #5: Show and Tell==
| |
| − | Eric and Britta are giving a talk about our project at a gathering about technology and wildlife management (I don't remember all the details), which I believe is happening right about now (Wednesday the 15th). In addition, we've submitted an abstract for a talk at the Citizen Science 2015 Conference (CitSci2015) at the San Jose Convention Center on February 11-12, 2015, and we'll be submitting an abstract for the Southeast Regional Sea Turtle Meeting. The meeting will be held February 4 - 6, 2015, on Jekyll Island, GA. The latter meeting is important because most of the groups working with sea turtles in the Eastern US will have representatives in attendance. It is my hope that we can interest a few more groups in getting involved in working with us and supporting our project.
| |
| | | | |
| | ==Phase Three Goals== | | ==Phase Three Goals== |
- Using high tech sensors and cell phone networks to protect sea turtle hatchlings
You can help support the project with a tax deductible donation (Click here).
Background
Sea turtles have existed for 100 million years, but in the last century, the impacts of man through accidental capture in fishing nets, habitat destruction, pollution, and plastics in the ocean have significantly reduced populations by as much as 95%. Six of the seven species nest in the warmer beaches of the US, and all of these are protected by the Endangered Species Act of 1973. Although volunteer groups and park personnel can identify egg-laying sites almost immediately, the hatching date (when they emerge onto the beach) cannot be predicted—it will happen sometime in a six-week period beginning 50 days after the eggs are laid. All 100 to 150 of the sea turtle hatchlings in a nest usually appear simultaneously (mostly at night) on some unpredictable date during that six-week period. The hatchlings “boil” out of the sand and begin a dash to the ocean, one of the most touching sights in nature.
Beginning at 50 days after the eggs are laid, the National Park Service (NPS) at the Cape Hatteras National Seashore fences off a lane from the nest to the ocean and forbids other access to that lane until either the hatchlings appear or the 100 days has elapsed. This long protection period creates conflicts with other uses for beach access, such as fishing and vehicular movement for recreation and safety. Conflicts are inevitable, often leading to lawsuits.
Project Objective

This project is developing technology to help protect sea turtle hatchlings at their first crisis: emerging from the egg and making it to the ocean. Hatching happens on an unpredictable day sometime during a six-week window beginning 50 days after the eggs are laid. Predicting the hatching date to within a few days is the goal of this project.
The goal of the project is to develop simple, inexpensive technology for determining when a "boil" will occur with as much accuracy and reliability as possible. The current design employs a sensor that measures egg motion either as the embryos agitate in the egg or as the sea turtle hatchlings begin to pip out of the eggs or both. The results, perhaps including modeling, will hopefully be able to predict hatching dates (arrival on the beach) to a reliable one-to-three-day window, a significant improvement over the current six-week window. Developing a reliable technology for predicting hatching will allow the NPS to create a new protocol for protecting the nests, thus freeing up access to the beaches for a significantly longer time.
There are several possible beneficial side effects of the technology:
- The technology can be used to help develop ecotourism around the hatching of sea turtles. Once people (especially young people) experience the hatching of these creatures, they may be much more likely to think positively about the welfare of sea turtles in the future.
- If local people can develop an income around this ecotourism activity, they may be less averse to the obstructions to beach vehicles and foot traffic.
- The technology might be useful for scientists studying sea turtles and might be adaptable for the study of other egg-laying species.
All the designs and software code will be published on this website and will be available for use worldwide. All data created by the system will be made available to researchers worldwide.
History
The device began with an idea from Eric Kaplan, founder of a company that develops Bluetooth wireless technology test equipment. Kaplan sold his company to his employees and later founded the Hatteras Island Ocean Center (www.hioceancenter.org), a nonprofit, 501(c)(3) ecology education center on Hatteras Island in North Carolina. Kaplan saw the need for this technology and approached his childhood friend Tom Zimmerman, an IBM Research–Almaden (San Jose, CA) electrical engineer for assistance. Zimmerman designed the sensor package in 2013 as a public service commitment from IBM. Tom recruited his college buddy, Samuel Wantman a retired software designer, and they worked on developing the first phase of the design with support from IBM and from the National Park Service. Britta Muiznieks, a biologist with the NPS has been coordinating the Park's involvement. The first phase of the project was a very quick and inexpensive hack of cell phones with a simple custom circuit board to test the viability of the project. The devices were tried in a few nests in 2013, but unfortunately it was too late in the season to get any data from viable nests. Even so, there was enough learned to make everyone involved in the project believe that there was the potential to make the technology work.
Wantman took over management of the project in 2014, as Zimmerman had to return to other commitments at IBM. Additional volunteers were recruited, including David Hermeyer a retired electrical engineer and Charles Wade a retired IBM Research manager. Phase Two of the project involves developing a more robust custom sensor embedded in a plastic sphere the same size and shape as a turtle egg, with industry standard technology for transmitting data over cell phone networks. Installation has begun on multiple sensors that the NPS is funding for field testing in 2014. The project inspired Samuel Wantman to start Nerdswithoutborders.net to help organize the project, recruit volunteers, and inspire other projects. All of the Turtle Sense project members, with the exception of the NPS employees, donate their time. The Hatteras Island Ocean Center is the sponsoring non-profit institution that administers receipt and disbursement of funds for materials and other expenses.
Phase One Description
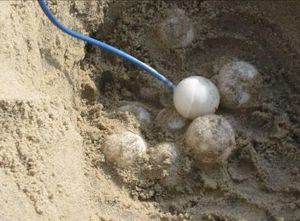
A ping-pong ball sensor assembly placed in a sea turtle nest (field tests 2013). The cable coming from the sensor leads to the communications tower for the cell phone connection.
For Phase One, a motion and temperature sensor sealed in a ping-pong ball was placed in the sea turtle nest. It was connected to a hacked cell phone that was programmed with a very small low-powered microprocessor to send out text messages with the motion and temperature data. Turtle eggshells are thick and leathery, so the hatchlings need considerable effort to emerge from the egg. After leaving the egg, the hatchlings remain in the nest for two-to-four days before exiting (usually) as a group onto the beach. All the resulting motions should activate the accelerometer sensor and thus provide data to the phone network. Field tests done at Hatteras in 2013 were positive. The tests were done at the end of the nesting season, and unfortunately the eggs did not hatch. However, the signal from a single surviving hatchling was eight times larger than the background signal, giving hope for the extensive tests planned for 2014.
Phase One Results (2013 Turtle Season)
Phase One was a proof-of-concept field test undertaken during the 2013 turtle season. A motion-and-temperature sensor (Analog Devices ADLX362, 3-Axil, Digital Output MEMS accelerometer), soldered to a Sparkfun “breakout board,” was soldered to a CAT5 cable. The board was sealed in a Ping-Pong ball by filling it with “aquarium safe” silicone caulk. The Ping-Pong ball, about the size and shape of the sea turtle eggs, was placed in the sea turtle nest by National Park Service (NPS) rangers. The other end of the cable attached to the "egg" assembly was electrically connected to a hacked cell phone that was programmed with a very small, low-powered TI MSP430 microprocessor. The phone sent out text messages with the motion and temperature data every two hours. The cell phone was protected from the elements by a communications tower made from 4" PVC pipe and pipe fittings.
Though the first device had its problems, field tests done at Hatteras in October 2013 were positive. The signal from the sensor close to a single hatchling was eight times larger than the background signal, giving hope for more extensive tests planned for 2014.
Phase Two Description
See also: Turtle Sense/Phase Two
Planning for Phase Two began during the implementation of Phase One. Samuel Wantman and David Hermeyer began working on the design for a more robust solution in the Fall of 2013. Units were installed by the NPS starting in June of 2014. We hope to install up to 20 sensors and 10 communications units through the Summer of 2014 and hope to predict some nest hatching beforehand.
Several problems were identified during Phase One that we hope to address in Phase Two:
- The sensors had reliability problems communicating with the cell phones because of the long distance between the sensor and the microprocessor in the communications unit. This is being addressed in two ways. The sensor was mounted on a very small (1 inch by 1 inch) circuit board inside the "egg" that goes in the nest. The board also contains a microprocessor and a RS485 transceiver that allows reliable communication over very long cable lengths.
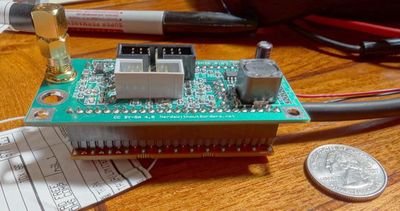
The 2014 communications assembly contains the circuit board, power supply, a microprocessor, an M2M cell phone board and RS485 transceiver. Inset is a quarter for size reference.
- The cell phone, having been designed with a human interface, was often unpredictable. Occasionally messages would pop up prompting a human reply (like a notification that the phone was charging). This made programming the device difficult because of all of the possible messages and the timing of their appearance are not predictable. At one point, the devices stopped working because the cellular service provider required all its users to upload new operating software. An appropriate user response was not possible in field-installed pre-programmed units. Because of this problem, we adopted industry standard M2M (Machine to Machine) methods of sending data over a cellular network.
- Text messages and disposable cell phones were not a cost-effective way to send large amounts of data. Phase Two uses FTP protocols with devices and data plans that have much less expensive data charges.
- Hacked cell phones would be difficult to mass produce, so the new design uses off-the-shelf, plug-in cell phone boards and custom circuitry that can be mass produced.
- Phase One used single-use D cell alkaline batteries. Phase Two uses rechargeable NiMH AA batteries and achieves longer battery life, as the package is carefully designed for low energy needs.
- Most of the turtle-specific calculations are now done in the microprocessor embedded with the sensor in the "egg." The communication system is designed so that it can be modified for other sensors.
- The silicone filling the ping-pong balls that housed the sensors in Phase One never cured. For Phase Two, we made a casting of a ping-pong ball (which is the same size and shape as a turtle egg), and used it to cast solid polyurethane "eggs" around the sensor circuit boards. The polyurethane is fully set in less than a day, does not out-gas, and is very hard and durable.
Phase Two results
- For more detail, see Turtle Sense / Project logs
Phase Three Goals
So it is time to start work on Phase Three. The goals of Phase Three are:
- To refine our hardware so that it is easier and cheaper to manufacture, more reliable, and easier to maintain.
- Extend the firmware so that it has better error handling, can be updated in the field, and offers more features and usable data.
- Create a working, somewhat complete website which does the following: automates the process of predicting hatching, reports predation events and over-washes; generates alerts for users; centralizes necessary data entry; and, allows open access of data for researchers and wildlife managers.
- Test the equipment and features in several different environments.
- Create a plan to get the technology included in protocols that are acceptable to the US Fish and Wildlife service.
Most of the work to make this happen will need to be done in the next few months. This month I'll be working on a schedule and budget for the next year and working on the abstract for the Southeast Regional Sea Turtle Meeting.
Data
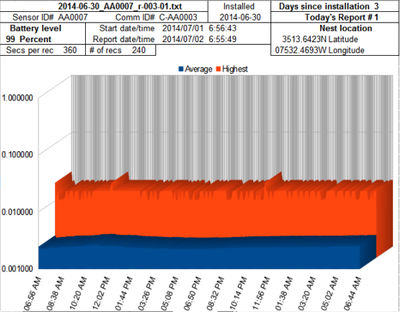
Data from the first report of the 2014 season
The Turtle Sense units constantly monitor and analyze motion to create a profile of its magnitude over time. The motion detector measures the change in acceleration (or "jolt") multiple times per second. The magnitude of the jolt is placed on a logarithmic scale divided into 25 different ranges. The ratio between the lower and higher limit of each range is the square root of two. A counter for each of the different ranges is incremented whenever a jolt reading is in that range. Each counter may be thought of as a bin. If a magnitude is in range, it is thrown into the bin for that range. After six minutes, the results are stored in a record along with a temperature and orientation reading, and a new set of bins counters is started. By looking at how many readings were in each bin, we can get an idea of what jolts occurred while the bins for that record were being filled. This allows us to compress several thousand readings into approximately 32 bytes of information. We lose precision with all the readings and the exact sequence, but we suspect that those details are not important. The 240 records created each day give us a very good idea of what is happening in the nest.
There has been some research that indicates that before emerging from the nest in a "boil," turtles that have hatched congregate underground near the top of the nest. It is thought that this motion stimulates the hatching of the turtles that haven't yet emerged. Our sensors, situated at the top of the nest, should record some large disturbances when the first turtles emerge. It is our hope that our readings will indicate these early hatchings so that we can predict that a boil is imminent.
The nests with first units installed in the 2014 season should be hatching around mid-August. We will be generating algorithms to predict hatching from our data and refining them to hopefully come up with a reliable process for predicting hatching a few days in advance.
Funding and Impact
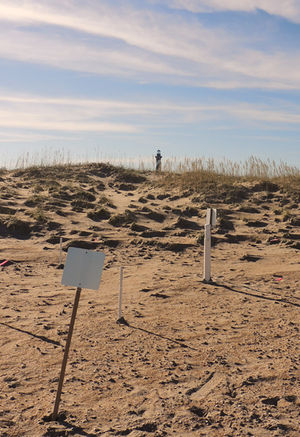
A few days after the first units of Phase Two were installed, Hurricane Arthur hit. The units reported regularly before and after the storm without any problems. This picture was taken the day after the storm. Notice how all the text was sandblasted off the sign in the forefront. Cape Hatteras Lighthouse is just behind the dune.
The National Park Service has approved funding for testing in the field beginning in June 2014. Labor is being provided by NerdsWithoutBorder.net volunteers. Additional support has come from:
If the tests are successful, we will seek funding and volunteers to expand the program.
Success in this project would provide widespread, international advantages. As noted above, the stress could be lessened between the protection agencies and the fishing industry, recreational users, and tourism advocates, all of whom desire more beach access. More effective international protection will be available, since the protection resources can be concentrated close to the hatch date instead of being stretched over six weeks. With a tighter hatching schedule, the public would have the opportunity to observe the hatchlings heading for the sea, an observation available only randomly now. This would improve the public support of the turtles. NPS will use the hatch dates in on-site announcements and information centers, and the Hatteras Island Ocean Center will disseminate the information in their programs. Much of the research on sea turtle eggs and hatchlings in the world could benefit from more accurate predictions of the hatch date. For example, studies that require capturing hatchlings for research could be done with much greater efficiency. Also, the sensor/cell network could be adapted for measurements of other species, including birds. Given its modest cost and energy efficiency (long battery life), it may have other uses in environmental studies. All the design information will be available to the public on the wiki http://nerdswithoutborders.net. If the project is successful, this information will be made available at cost or close to cost if sponsors come forward.
You can help support the project with a tax deductible donation.
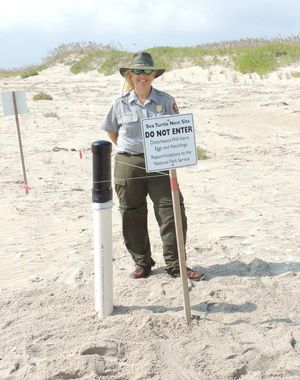
Britta Muiznieks, a wildlife biologist at the NPS Cape Hatteras Seashore in NC with a protected turtle nest. The 4" PVC pipe assembly tower was used in the 2013 testing. A smaller 3" structure holds the 2014 package because the electronics are smaller and AA rechargeable batteries have replaced D cells. Vandal-proofing is one aspect of the design. Britta does the field research for the NPS.
Press
Radio
Print
Web
Links


_cropped_small.jpg)
